Sustainability: Reducing the CO₂ Footprint in Toursim with Digital Tools
2025-07-12
Sustainability: Reducing the CO₂ Footprint with CityBot
How digitalization in tourism can make cities and regions more sustainable
Smart city concepts should focus on people: easier access to documents and information, safe navigation through the city, pleasant climate, and much more. This also includes enabling people to live sustainably concerning the environment and social surroundings. Especially under current circumstances, where 6 out of 9 planetary boundaries have been exceeded, it's more important than ever to leverage every opportunity to mitigate the impacts of climate change on humans and the environment.
Digitalization allows us to minimize paper consumption, thereby saving resources and transportation. But how do we compare the environmental impact of paper versus electronic versions? One method is the life cycle assessment (LCA). It systematically quantifies all environmental impacts of a product. LCAs can be extensive, especially when all effects on nature and society are considered. One of the most well-known simplifications is the CO₂ footprint, focusing solely on CO₂ emissions. This simplification is ideal for presenting and communicating results easily.
Below, we gain insight into the CO₂ footprint comparison between a paper tour guide and the CityBot app. As a preview: depending on the scenario, CityBot emits only about 1% of the CO₂ emissions of a paper tour guide!
Key Components of a CO₂ Footprint
Before diving into the LCA results, it's essential to understand the main elements. If you're already familiar with the topic, feel free to skip this section.
1. The Functional Unit (FU)
The functional unit (FU) is a central concept in calculating footprints. It ensures a fair comparison between two products. For example, when comparing light bulbs, an FU could be "burning a bulb for 100 hours at 150 lumens," or for food, "producing one kilogram of product." The FU can significantly influence the footprint result and should be chosen carefully.
2. System Boundaries
System boundaries help determine which life cycle stages are considered and which are not. Broadly, life cycle stages can be divided as follows:
- Raw material extraction
- Upstream transport (including storage) for further processing
- Processing
- Downstream transport (including storage) to end-users
- Usage
- Disposal
- Others, such as investments, commuting, etc.
For paper, for instance, we're interested in emissions from logging, transport to the paper mill, up to delivery to consumers. System boundaries significantly influence the footprint result. It's crucial to ensure no major components are unjustifiably neglected.
3. Emission = Activity × Intensity
To determine CO₂ emissions (the goal of our footprint), we need to know how much we use something (activity) and how much it emits (intensity). For example, to estimate the CO₂ footprint of our diet, we need to know how much vegetables or meat we consume and the environmental impact intensity (kg CO₂/kg of vegetable or meat). Multiplying both (activity × intensity) gives us our CO₂ footprint.
4. Sensitivity Analysis
Every footprint, like any model, involves uncertainties. The impact of these uncertainties can be assessed through a sensitivity analysis, where each parameter is varied within its uncertainty range. This is especially important when comparing two products, like the paper tour guide and CityBot. We want to ensure that even in the worst-case scenario for one product and the best-case for the other, the result still clearly indicates which product is better for the environment.
Comparing the CO₂ Footprint: CityBot vs. Paper Tour Guide
1. The Functional Unit (FU)
The FU for both products is "usage for 1 hour per week over an entire year." The 1 hour per week is a rough estimate from our usage statistics, and since most paper tour guides are printed annually with the latest information, we consider this FU appropriate.
2. System Boundaries
All significant life cycle stages were considered. Specific assumptions were made for both products (see below). For both products, no other life cycle stages (e.g., investments) were considered, as they are deemed negligible.
CityBot: The CO₂ emissions of the phone's life cycle (excluding usage) were allocated to the usage time (1 hour per week for a year) based on this Scope3 methodology.
Paper Tour Guide: CO₂ emissions during usage were neglected, as, for example, reading the paper tour guide doesn't produce emissions.
3. Emission = Activity × Intensity
Not all activities and intensities are listed here. If you have questions, feel free to contact us. However, the main assumptions are briefly listed:
CityBot
- Phone usage: Activity data from Bryce Energy Services and intensity from Swiss electricity mix by FOEN
Paper Tour Guide
- Raw material: Activity is A5 paper (148 × 210 mm; area 0.031 m²) with 80 g/m² and 50 double-printed pages, and intensity from Milgro
Comparing the CO₂ Footprint: CityBot vs. Paper Tour Guide
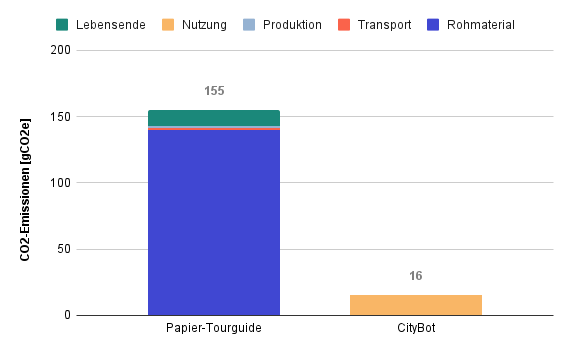
The graph below shows the emissions of each life cycle phase: left for the paper tour guide and right for CityBot. The total emissions for the paper tour guide amount to just over 155 g CO₂e per year, mainly caused by the paper. With approximately 16 g CO₂e per year, CityBot emits only 10% of the emissions of a paper tour guide. The emissions mainly occur during usage (as mentioned above, usage includes an allocated portion for the remaining life cycle phases).

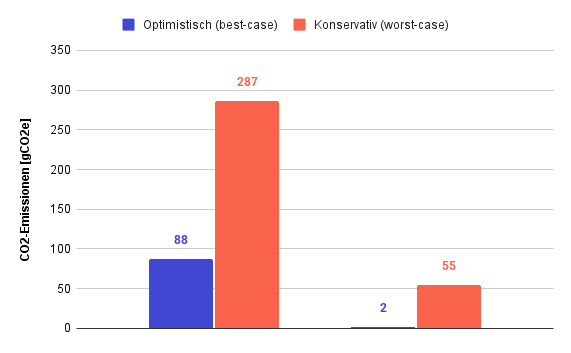
As mentioned, a sensitivity analysis is part of every footprint to assess the impact of assumptions on the result. It shows that even in the best-case scenario for the paper tour guide (about 88 g CO₂e), it still emits more than 30 g CO₂e more than CityBot in the most conservative case. Conversely (conservative case for the paper tour guide, best case for CityBot), CityBot emits just under 2 g CO₂e, less than 1% of the paper tour guide.

Limitations
Every life cycle assessment involves uncertainties. The analysis presented here was not specifically conducted according to ISO standards and should only be considered indicative. For any claims regarding CO₂ reductions, the analysis must be tailored specifically for the city. Additionally, this analysis focuses on CO₂. A complete life cycle assessment should also cover other areas of nature. Nevertheless, this analysis shows: CityBot can benefit both people and the environment.
Conclusion
With CityBot, cities can reduce their CO₂ footprint.
- 🗺️ Paper tour guides cause emissions, mainly due to paper production
- ➤ CityBot emits on average only 5% of a paper tour guide, and in the best case, even less than 1%
- 📈 Despite the limitations of the presented analysis, it shows that CityBot has CO₂ reduction potential
Whether a regional destination management organization or a small municipality — with CityBot, the transition to digital tourism management succeeds.
👉 Ready to find out what this could look like for your destination?